A Comprehensive Guide to Working with Congressional Data in R
- Congressional Datasets – An overview of available datasets covering different aspects of Congress, from off the shelf data to publicly available government data to other niche sources.
- Working with Congressional Data – How to start working with existing data, including merging datasets together by common IDs, wrangling data into proper formats, and creating new measures such as bill introductions. This is a great introduction to working with R’s
tidyverseframework in a practical setting. - Messy Congressional Data – What do you do when you have two datasets that don’t share IDs? This guide goes through first how to clean up these data and prepare them for merging, how to merge, and then how to fix errors. It also shows how to work with publicly available data and replication files and put them into an existing dataset that is ready to use for regressions and visualization.
- Descriptive Statistics and Visualizations – So you finally have your dataset ready to go, now what? Here I cover how to produce practical summary statistics, including tables that can be exported into LaTeX, as well as more complex examples of conditional summary statistics. I also show examples of simple and complex visualizations that are ready to be put into academic papers or blog posts.
- Working with Models – You’re ready to run some regressions. This guide shows the basics behind working with linear models including those with high-dimensional fixed effects using the
lfepackage. I then show examples of working with model output, extracting certain coefficient values, creating coefficient plots, and plotting predicted results. - Regression Discontinuity – Getting started with regression discontinuity is a bit intimidating. Here, I show it’s actually quite easy using
ggplot2and therdrobustpackage.
Miscellaneous Tutorials
I’ve written a few tutorials on practical applications of R for data science, including visualization, maps and shapefiles, and web scraping. These tutorials are not meant for absolute beginners as some knowledge of R syntax and the tidyverse are recommended. However, you do not need to have much experience with web scraping, ggplot, or tidyverse grammar to get these to work and use them in your own applications.
1. Web scraping with rvest and tidyverse
Learn basic webscraping with the rvest package and the tidyverse!
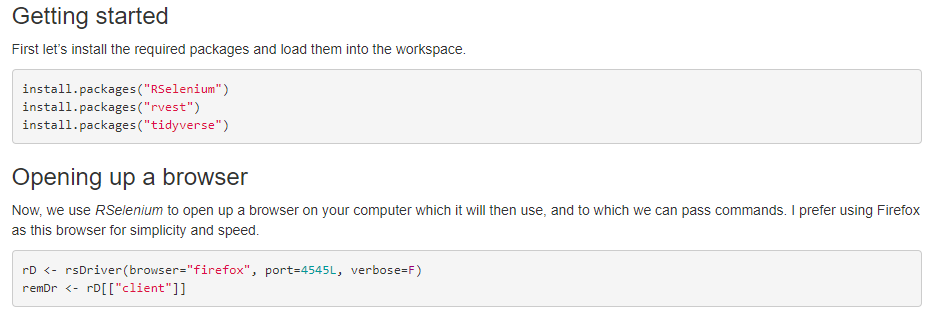
2. Web scraping with RSelenium
This tutorial is meant as an introduction to RSelenium for webscraping. If you’ve come across a website you can’t figure out how to scrape – typically because the normal downloading of HTML doesn’t produce what you want – RSelenium is more often than not your solution. This tutorial assumes basic knowledge of R, rvest, and tidyverse functionality (specifically, pipes: %>%). However, the usage of these packages in what follows is fairly straightforward in order to cleanly demonstrate the utility of RSelenium.
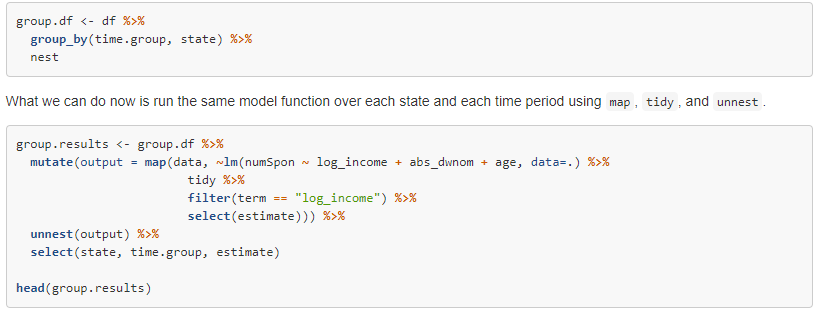
3. purrr: Introduction and Application
This tutorial provides a brief introduction to the purrr package, focusing on what I find to be the most useful functions and how they combine with dplyr to make your life easier. The purrr package is incredibly versatile and can get very complex depending on your application. Here, my goal is to build intuition around particularly the map family of functions by showing real-world applications, including modeling and visualization.
If you’re familiar with the logic behind base R’s apply family of packages, this intuition should be familiar. purrr is also meant to replace the now deprecated dplyr::do.
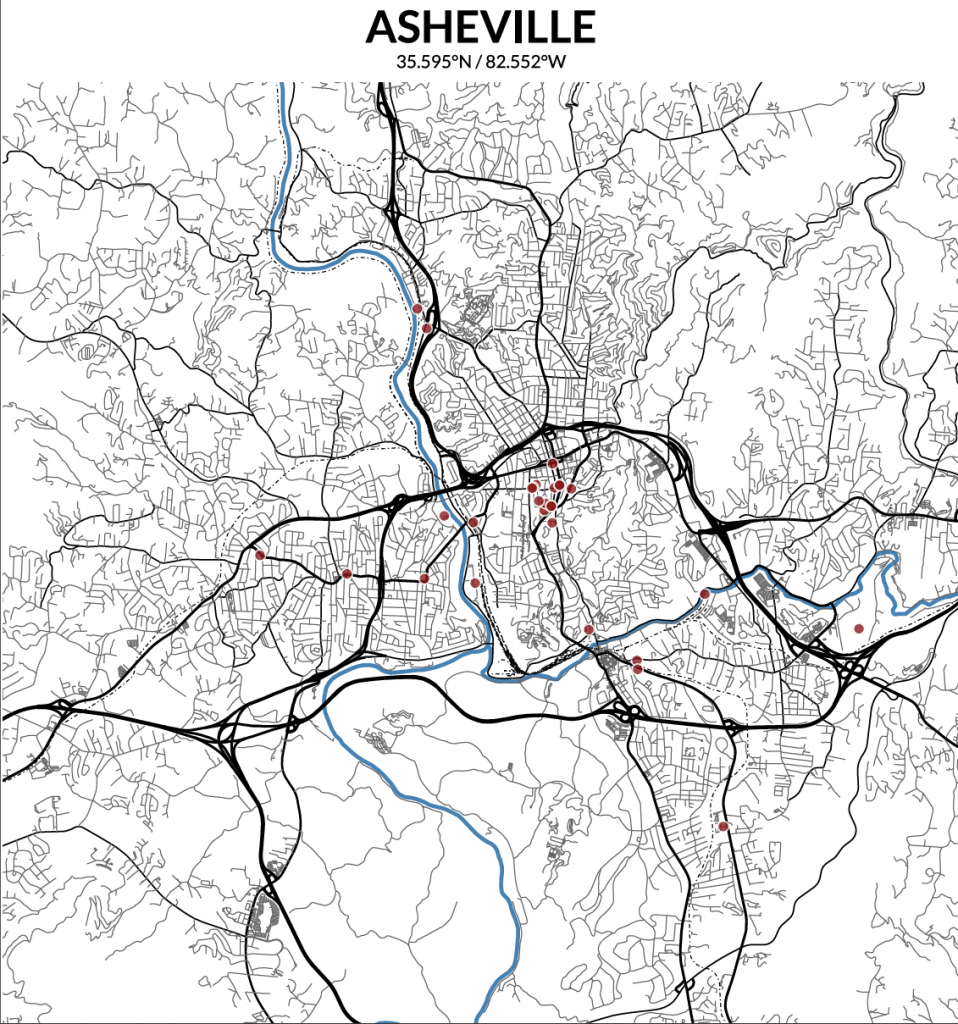
4. City and street maps using R, ggplot, and Open Streets
This tutorial is going to demonstrate how to make gorgeous maps of cities using streets and other geographic features. This is enabled by the osmdata package. I borrow heavily from the excellent tutorial at ggplot2tutor.com. I extend this tutorial in order to a) demonstrate deeper functionality of this package; and b) to provide additional instruction and application in ggplot, the tidyverse, and rvest.
I’ve given one of these maps as a gift, printed in a large poster format and framed. You’ll be able to make and customize your own maps and learn some new R functionality along the way.
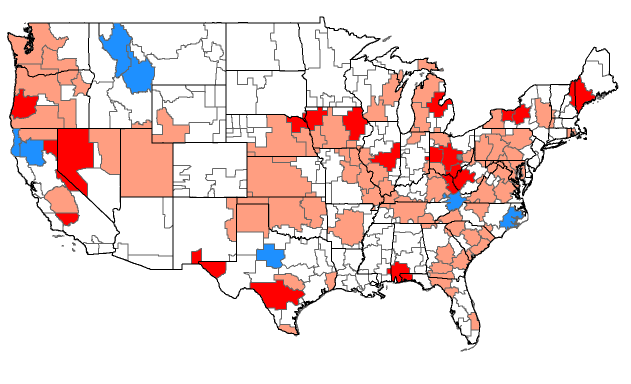
5. Working with shapefiles, maps, and ggplot
This tutorial covers essential mapping functions for data visualization using ggplot2. I cover how to load in and work with shapefiles downloaded from the internet (e.g., from the Census) and how to create maps using these files. I then show how to merge in data to shapefiles to create maps for applied work in political science and economics (and other disciplines), using replication data from published research.
Finally, I show how to work with R packages that have built in map data for creating chloropleths at the state and congressional district level.