I’ve redone some of the congressional staff salary data visualization. These data come from publicly released House and Senate disbursements which list job titles, staffer names, offices, and salaries. I’ve taken a version of these data cleaned by Legistorm, done some further cleaning to job titles and salaries, and adjusted salaries for inflation to 2016 dollars.
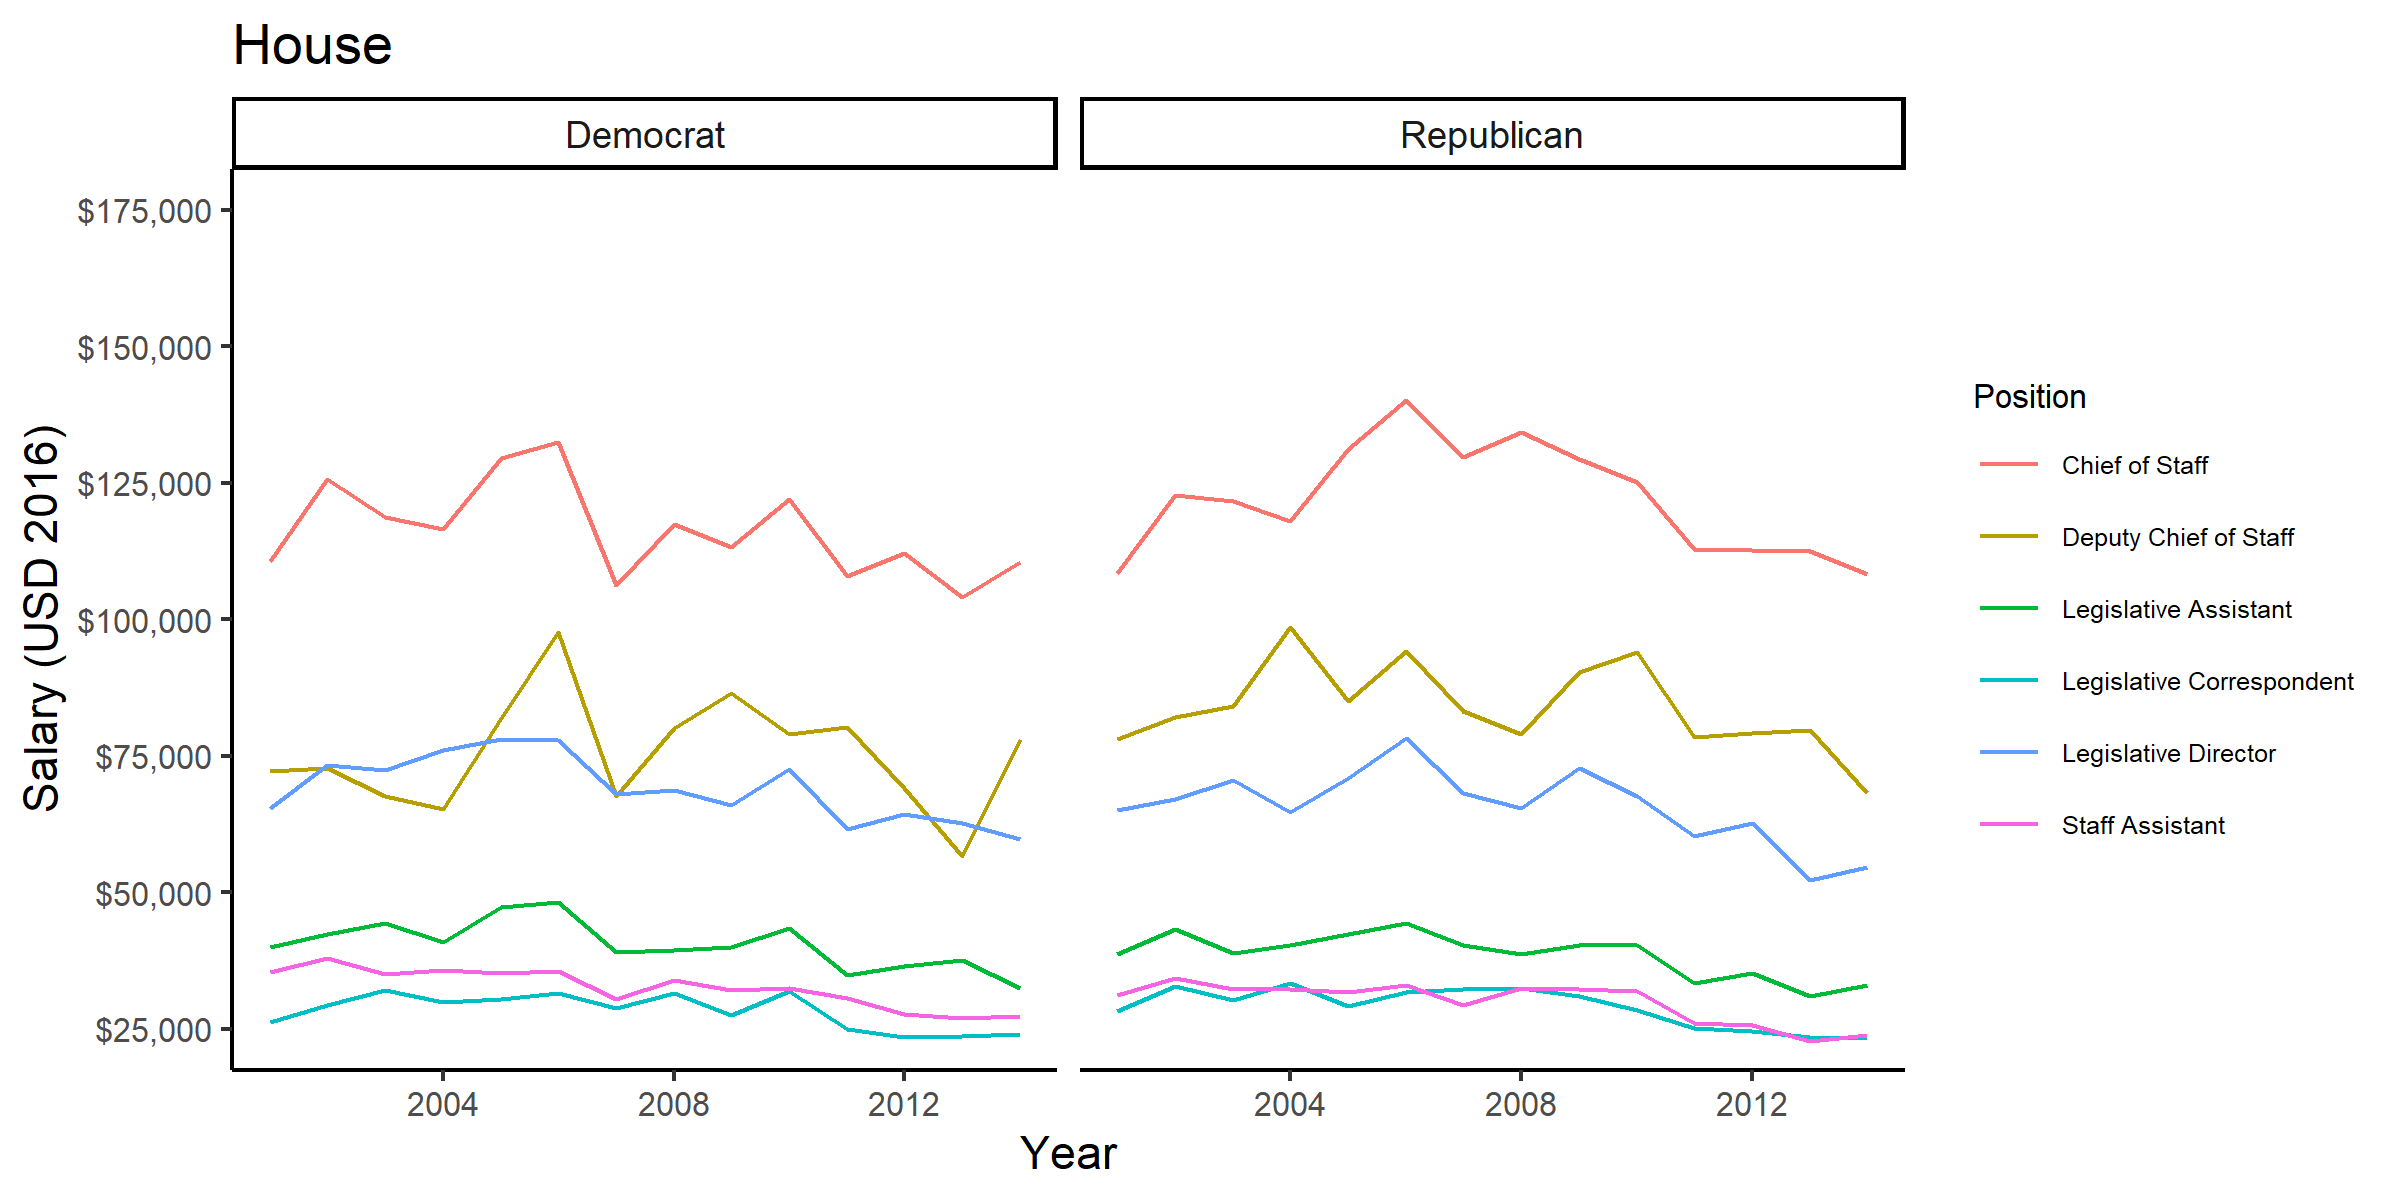
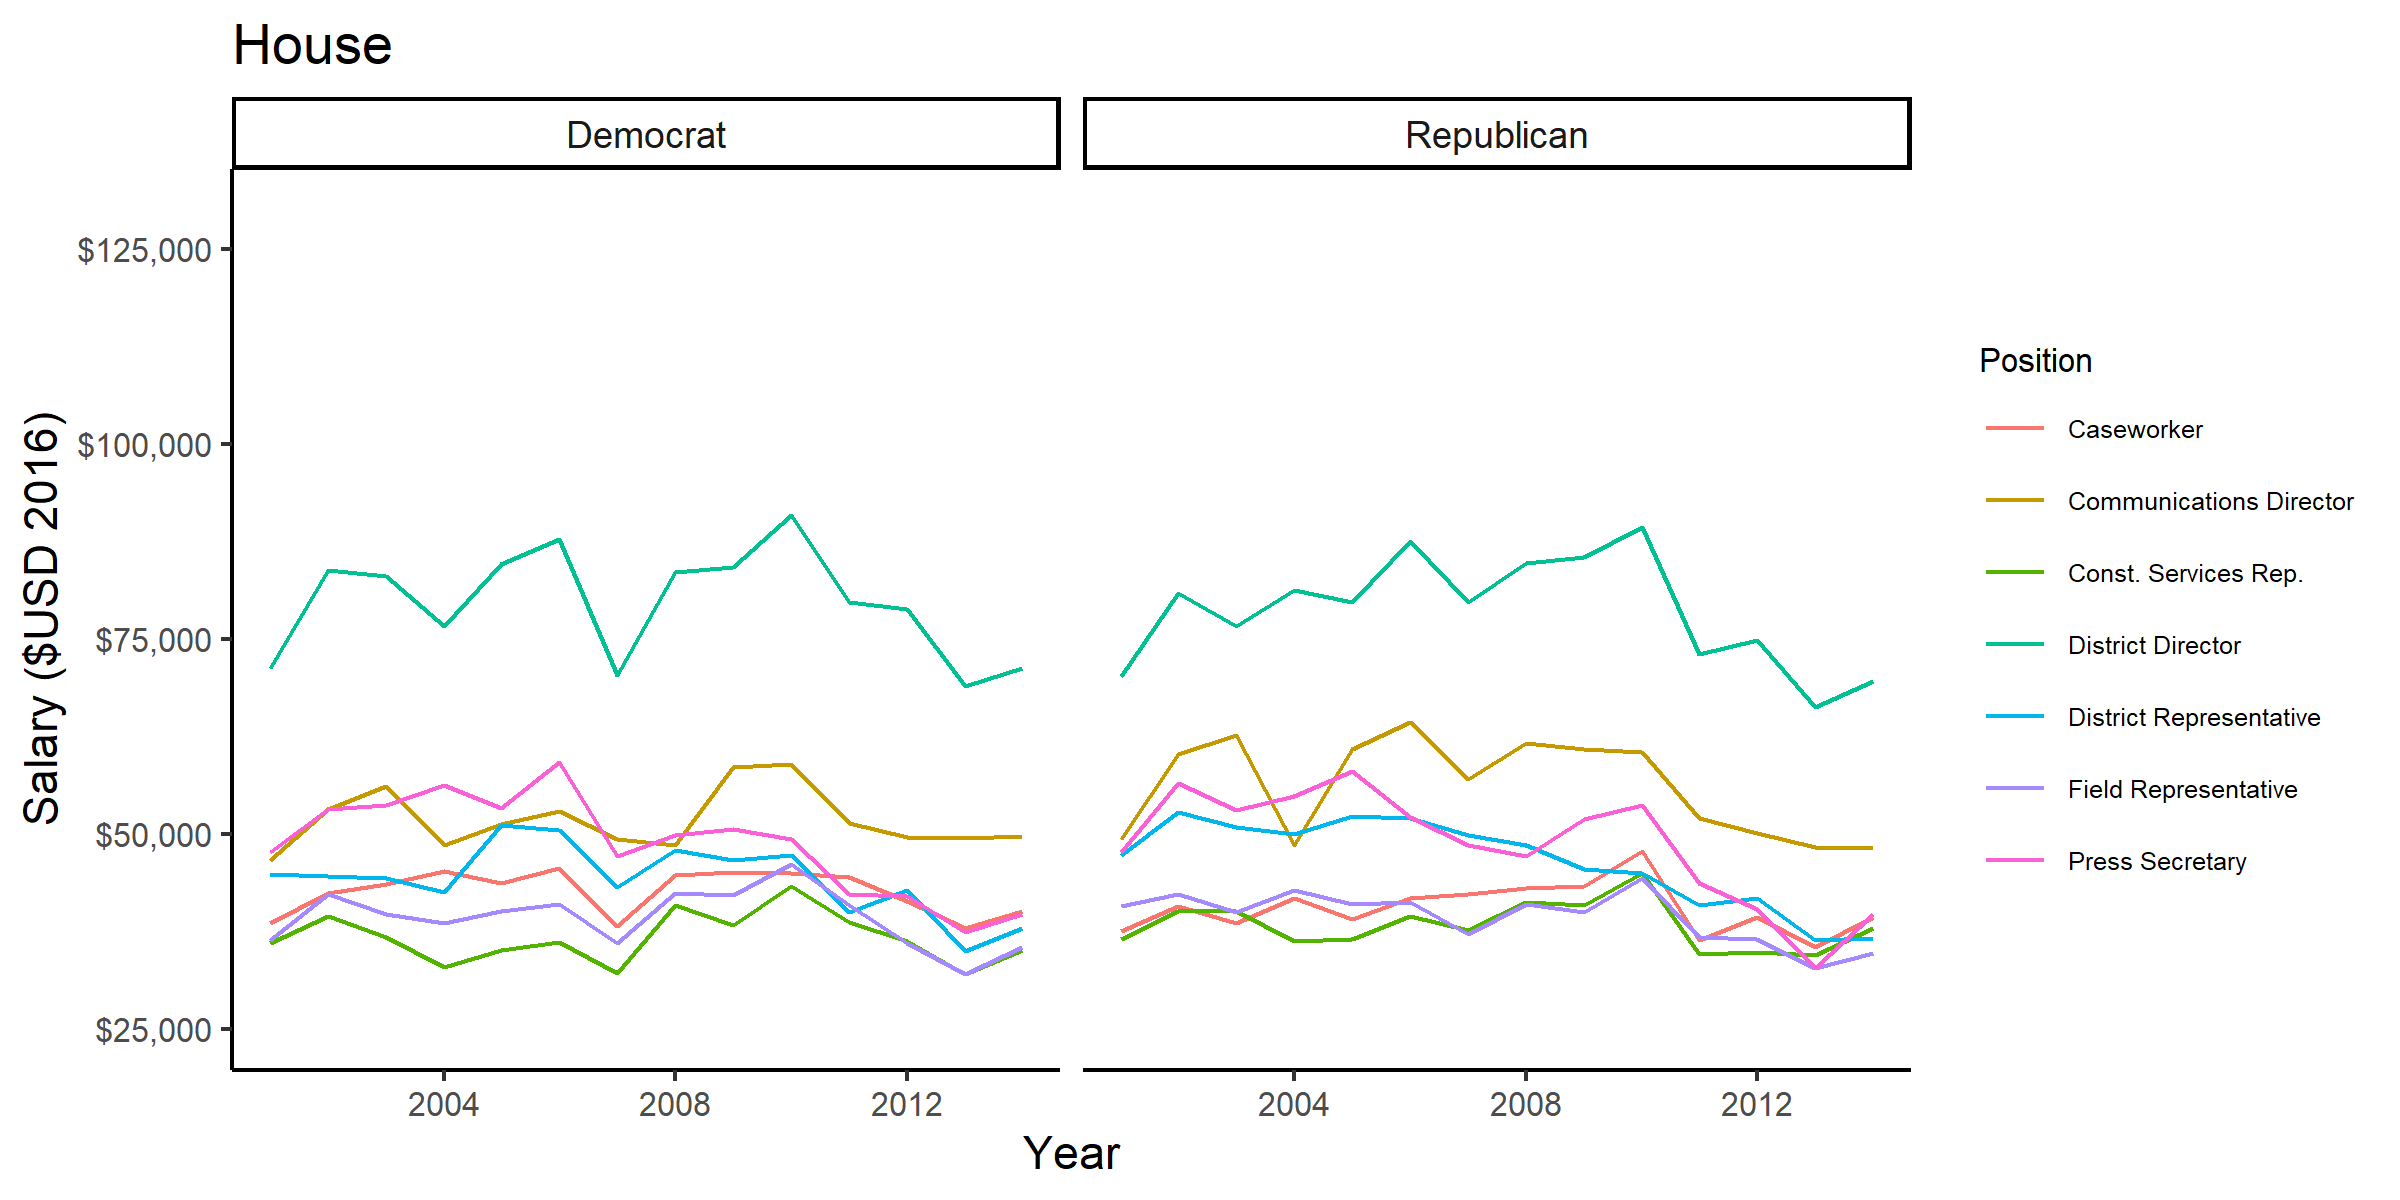
In this first figure we can see average salaries by common job title pooling both the House and the Senate together:
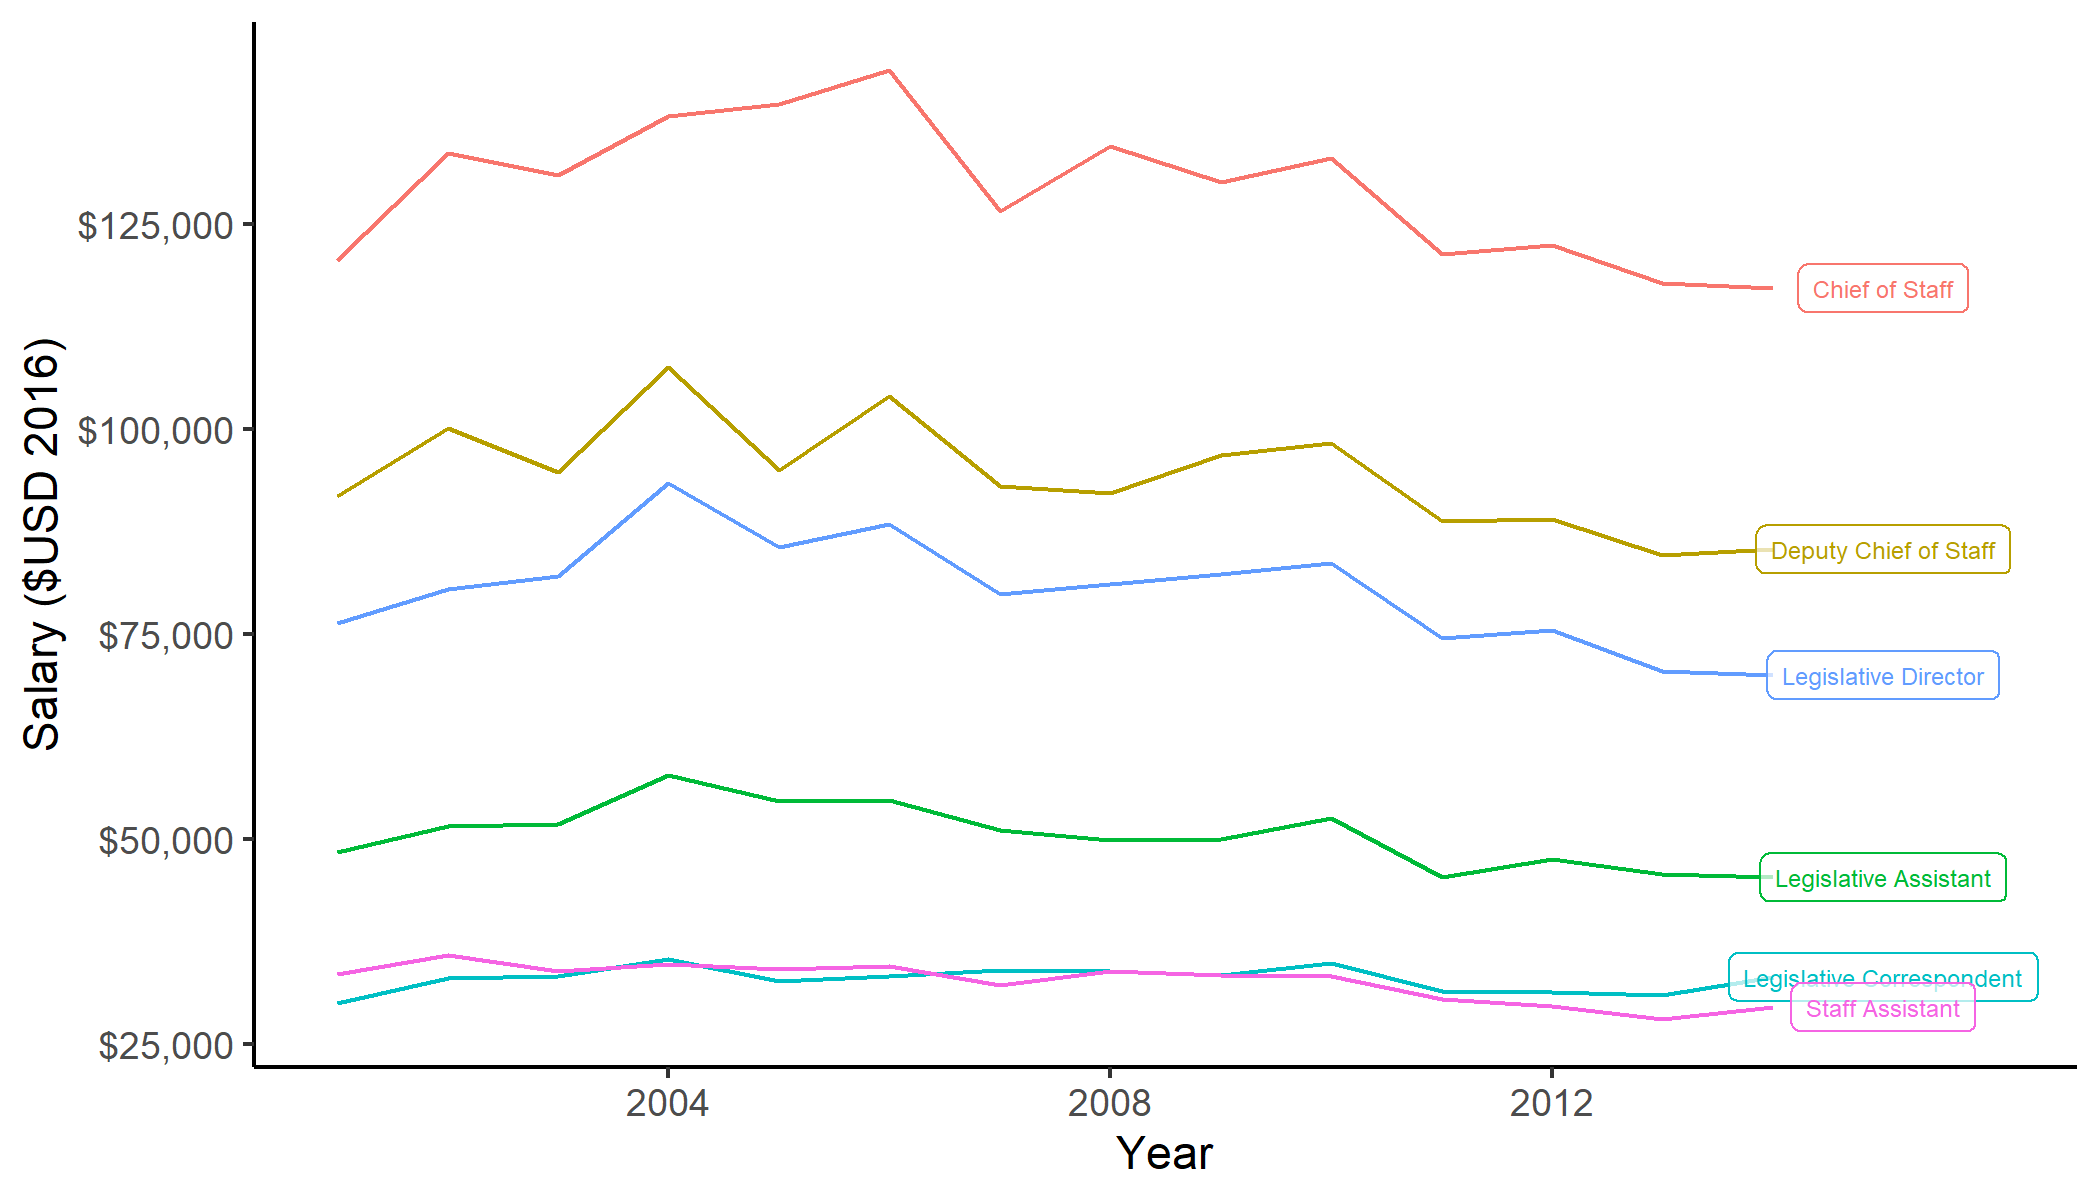
However, this figure is a bit misleading because Member Representational Allowances (MRAs) vary significantly between the House and the Senate. In the House, each rank-and-file member is allocated the same amount for spending on staff salaries (though they can then use it as they see fit, including not spending all of it — more here). In the Senate, a complex formula determines how much Senate offices are allocated. As a result, Senate offices have much more to spend on salaries which is plain this figure, where average salaries for common positions in the Senate are much higher:
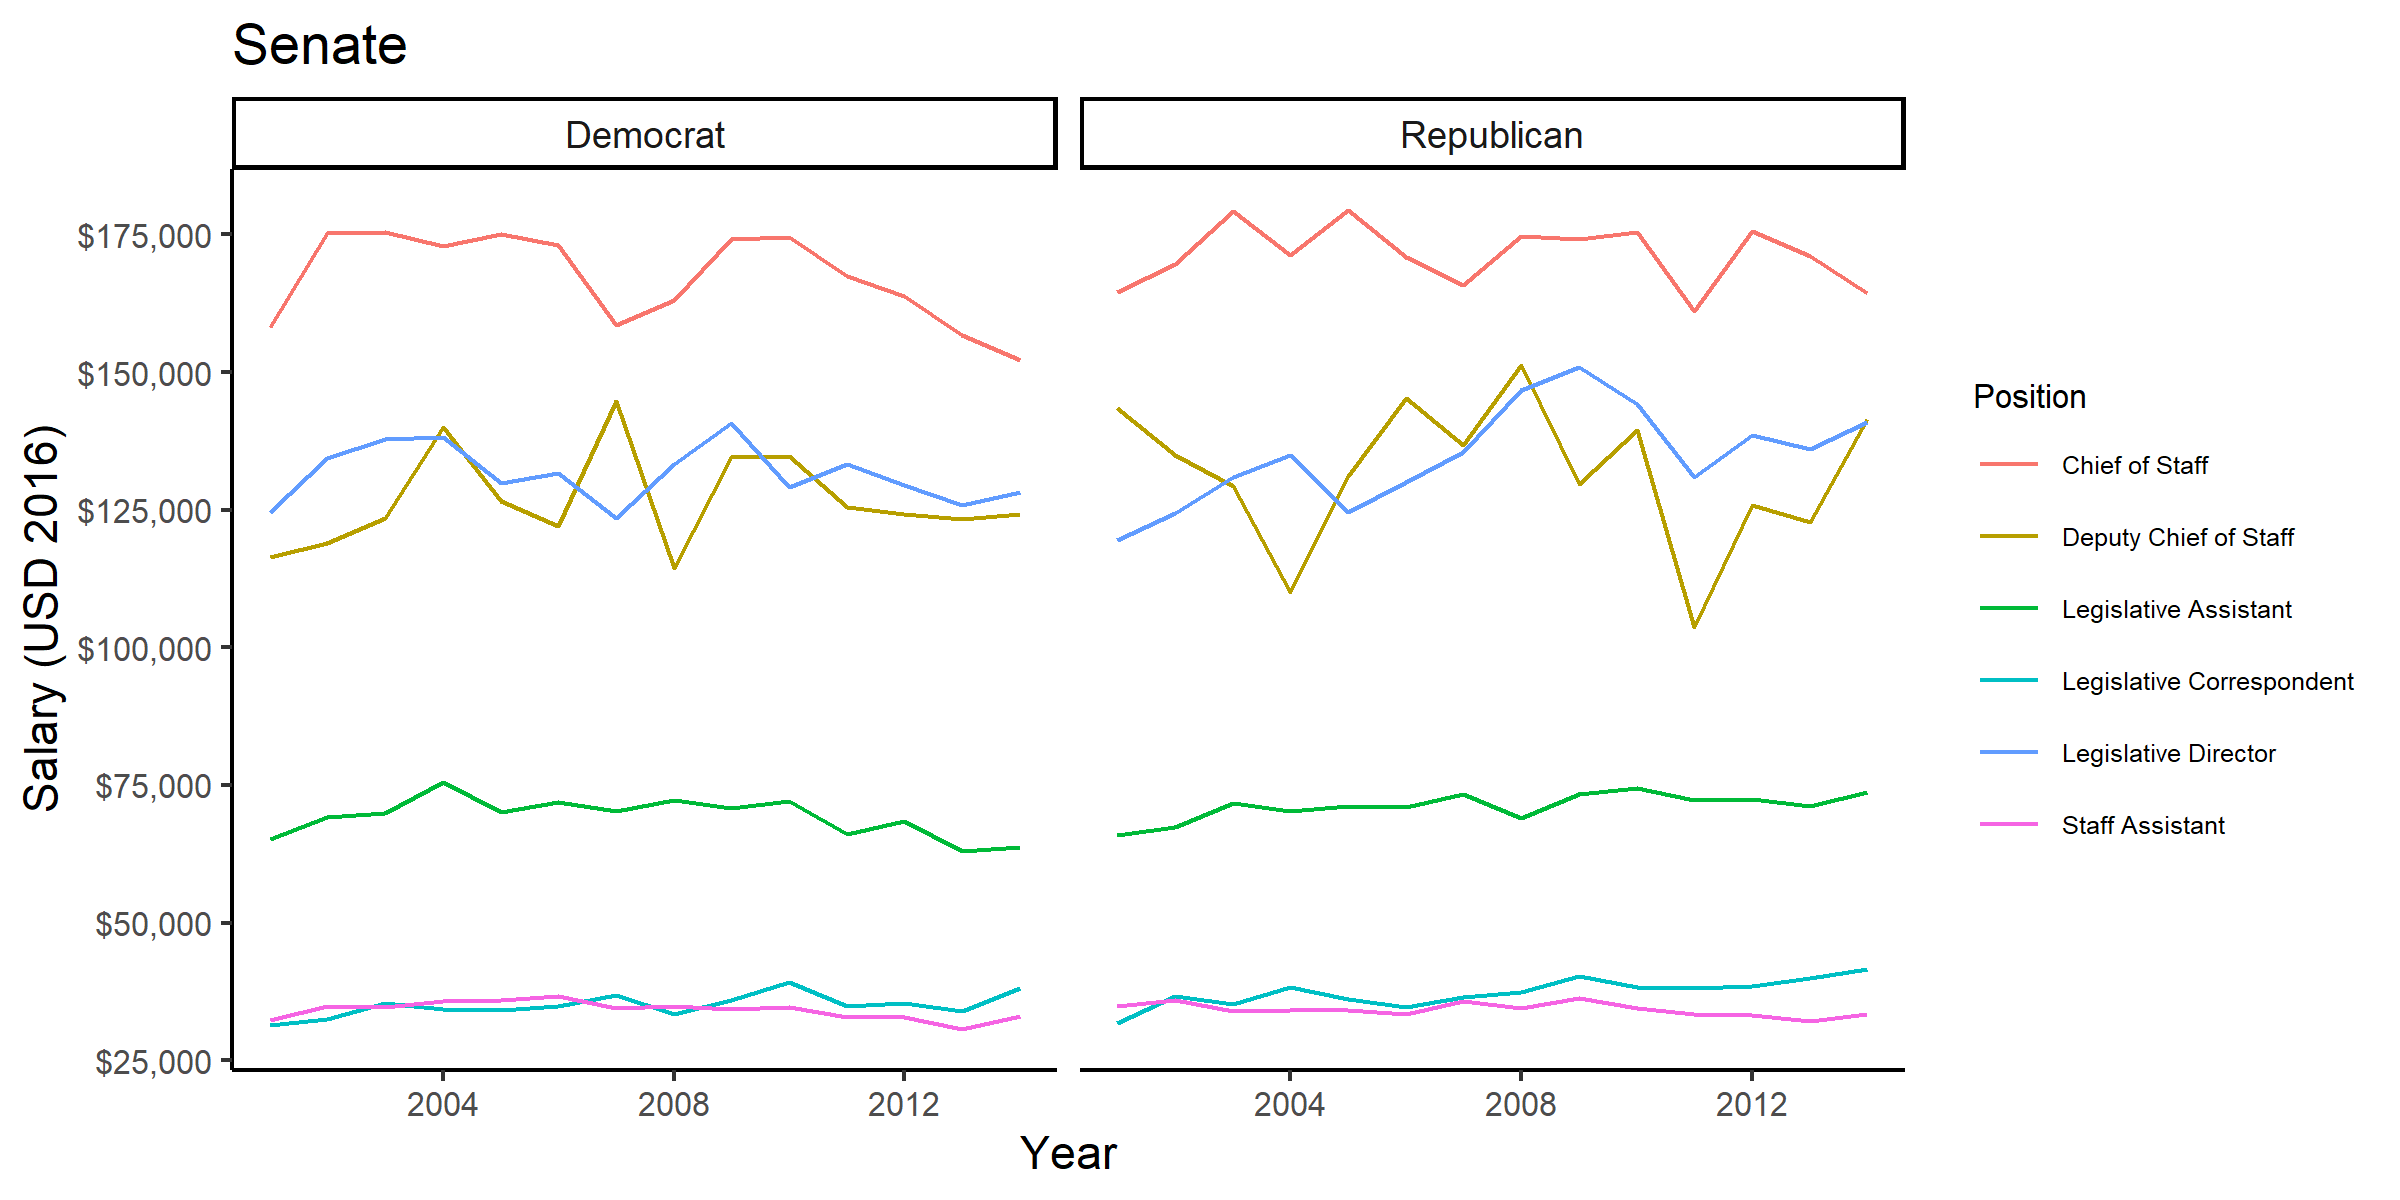
Note the difference now with the House, where Chief of Staff salaries barely get above $125,00 where they are much closer to $175,000 in the Senate. Similarly, Legislative Assistants in the House fluctuate around 40-50k, where in the Senate this is closer to 75k.
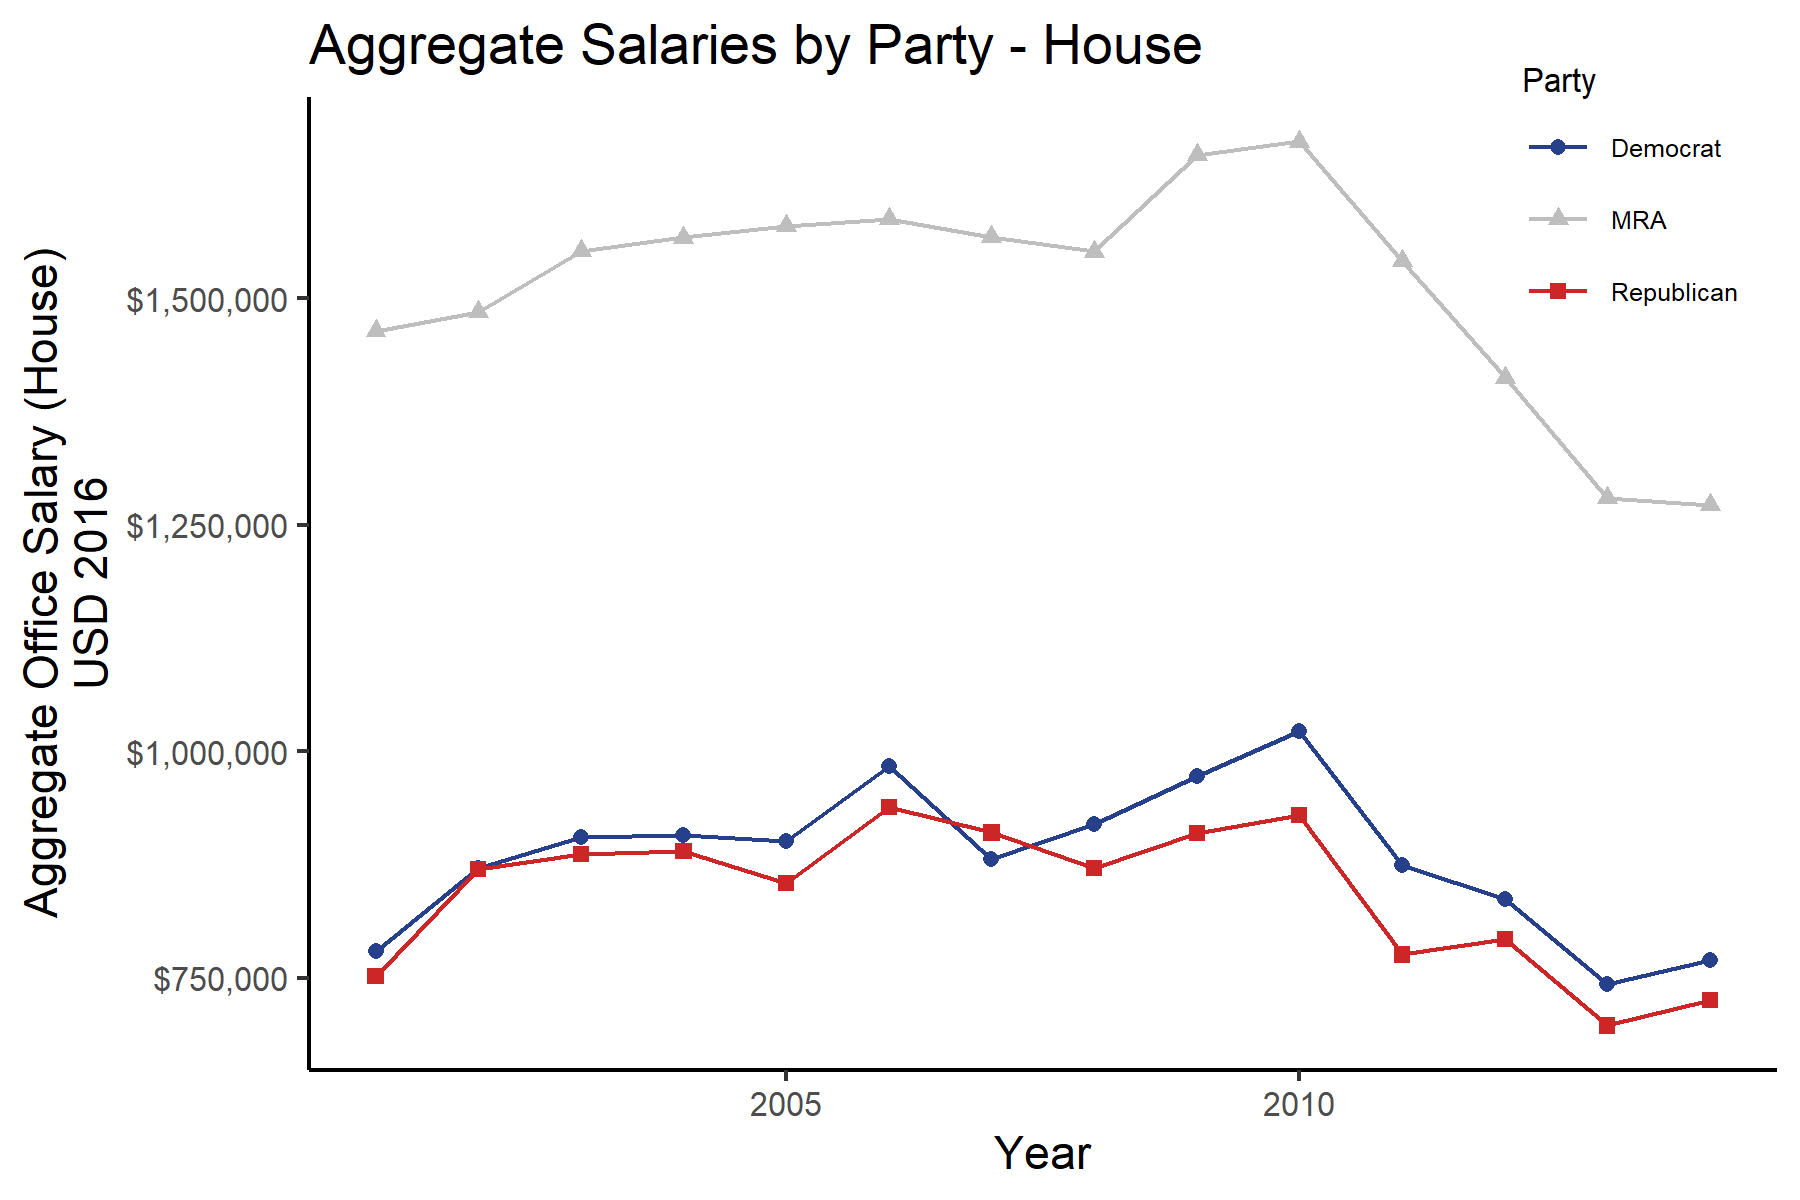
We can also use these data to look at how much offices spend in the aggregate on salaries. In the House, again, this is limited by the MRA. This figure plots the MRA (adjusted to 2016 dollars) against average aggregate salaries over time (in the House) divided by party:
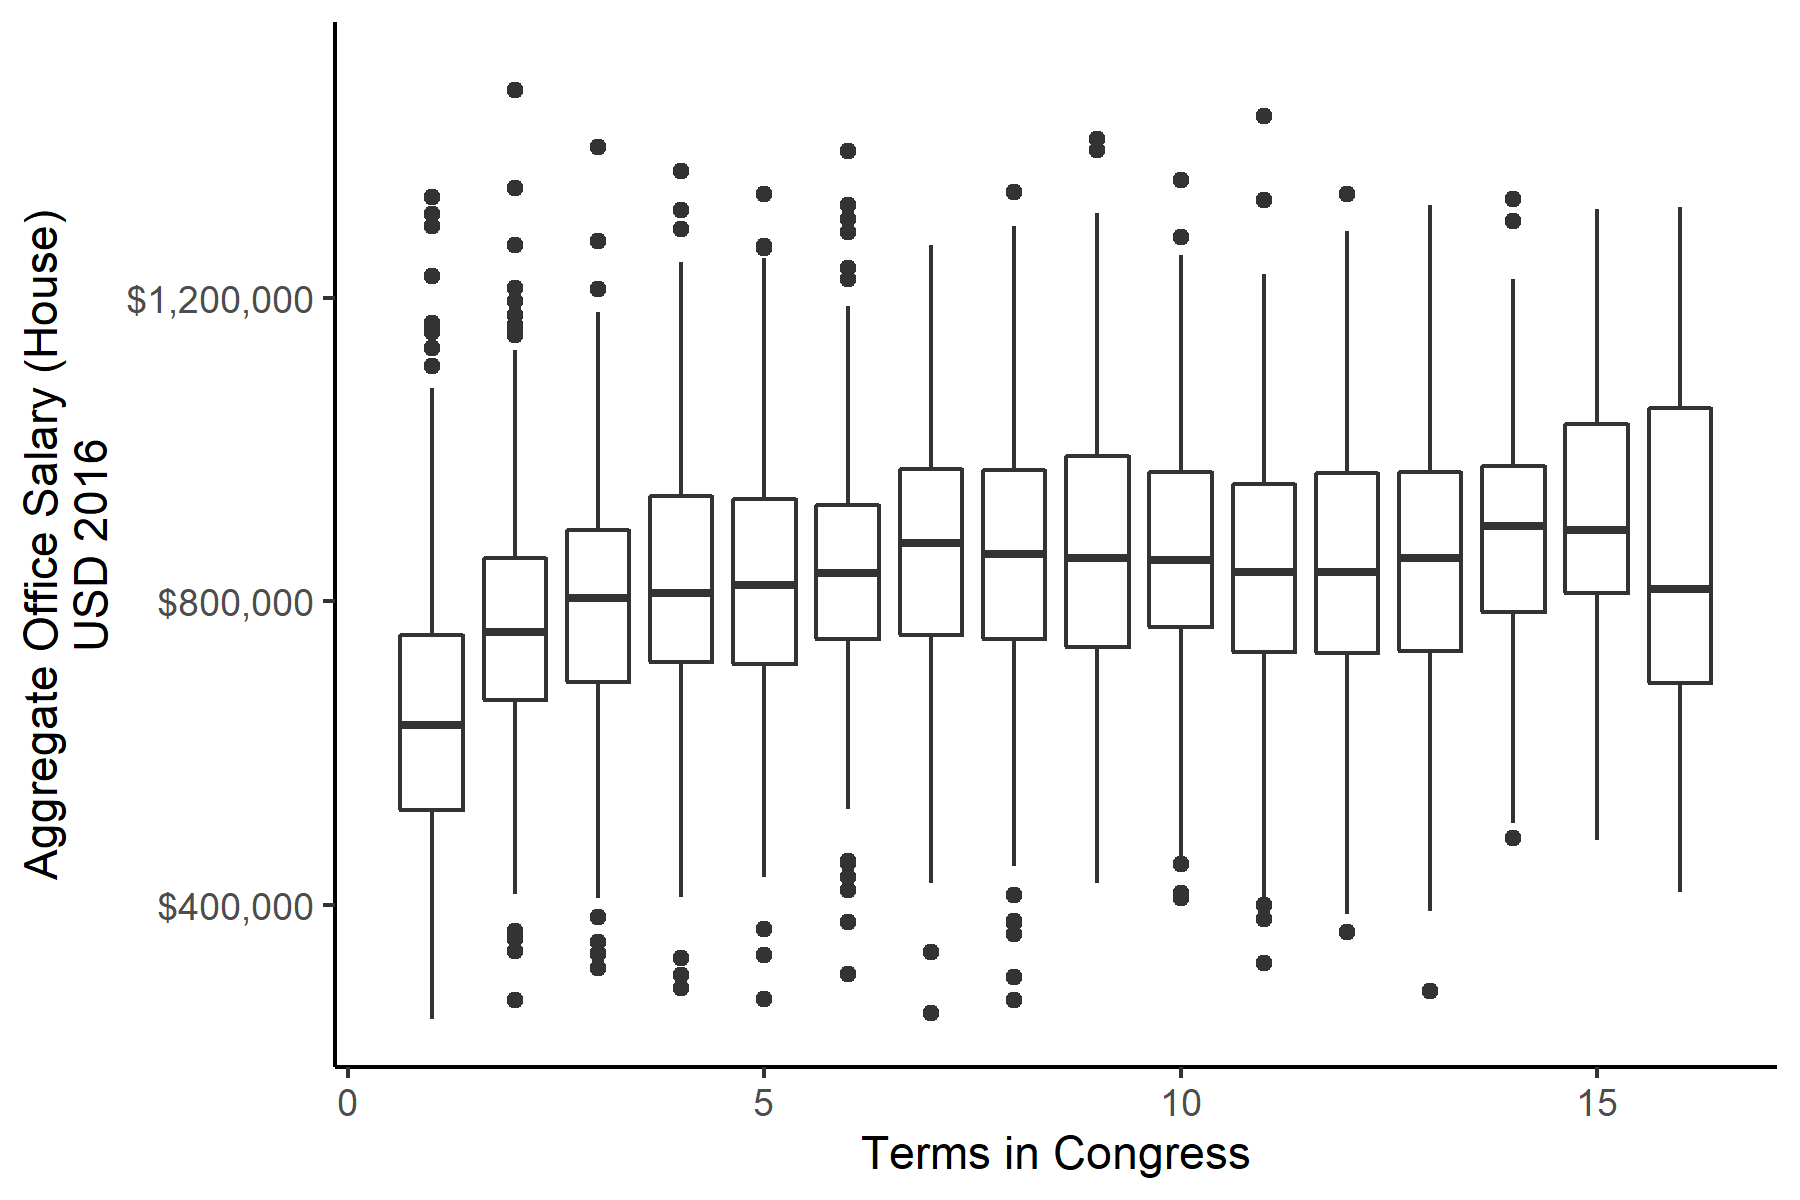
Finally, I’ve plotted aggregate salaries per office (in the House) by congressional term. As members increase in career length, they start to spend more on staffing (relative to other uses, such as franking). However, this starts to plateau around the 5th or 6th term in Congress: