I’ve been working on some new data combining lobbying data and congressional staff employment histories. These figures show how many offices hire lobbyists and how many offices lose staffers to lobbying.
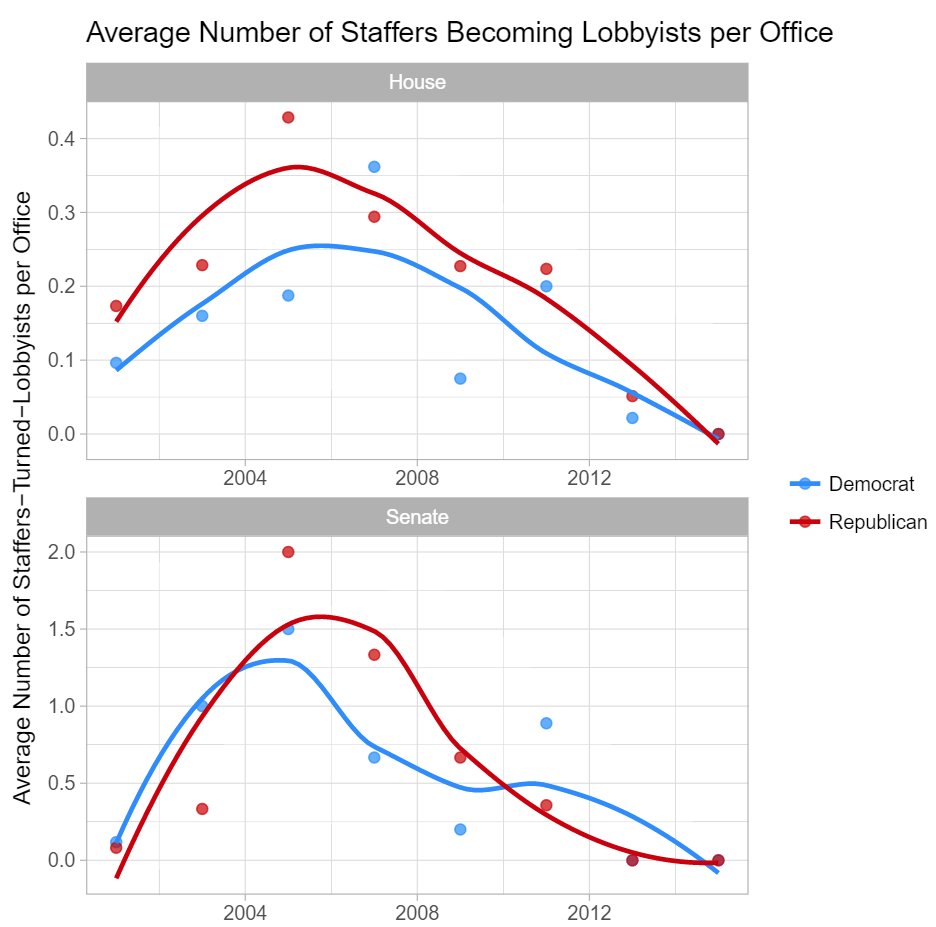
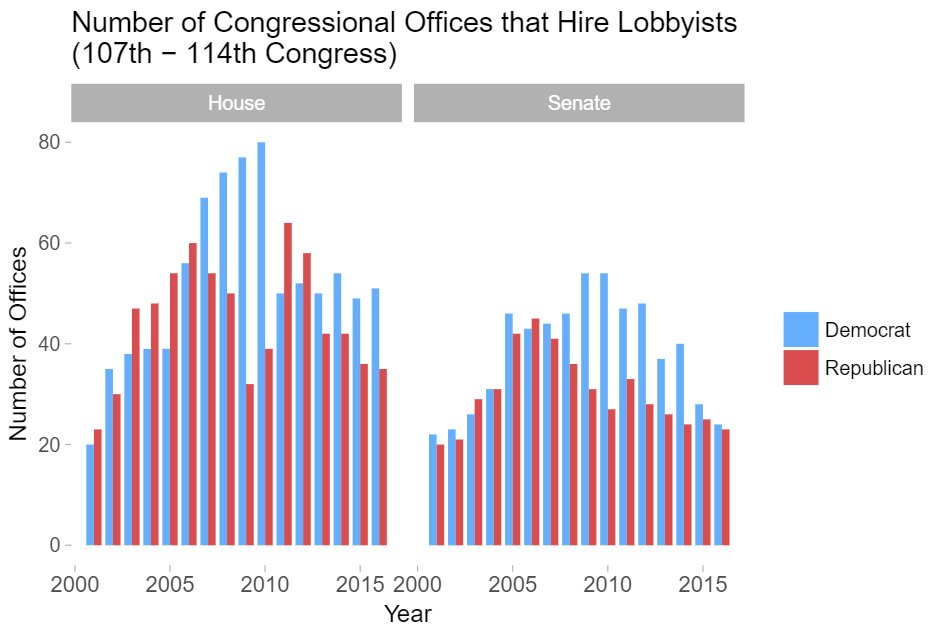
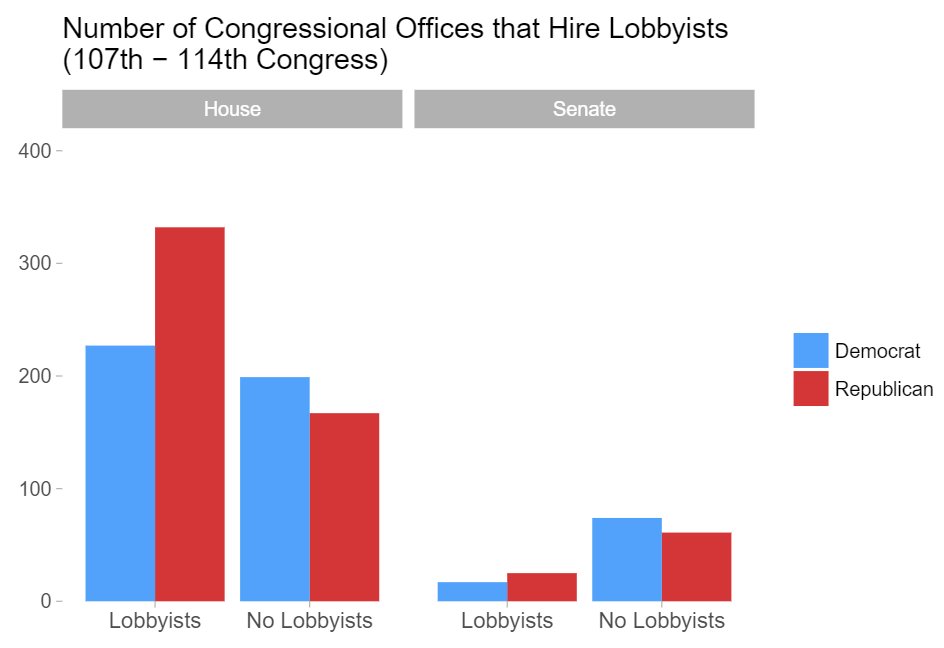
Some of the downward trends are surely due to the rise in shadow lobbying, where lobbyists are not registering as often as in the past because of regulatory changes. The partisan trends at different years are interesting in themselves, in my opinion.
All figures were made in R with ggplot2.